Launching the Big O Visualizer
Today marks the official launch day of the Big O(omicron) Visualizer on https://omi.cr. This tool provides a framework for analyzing the performance of algorithms by making it's run time complexity visual in an appealing graph.
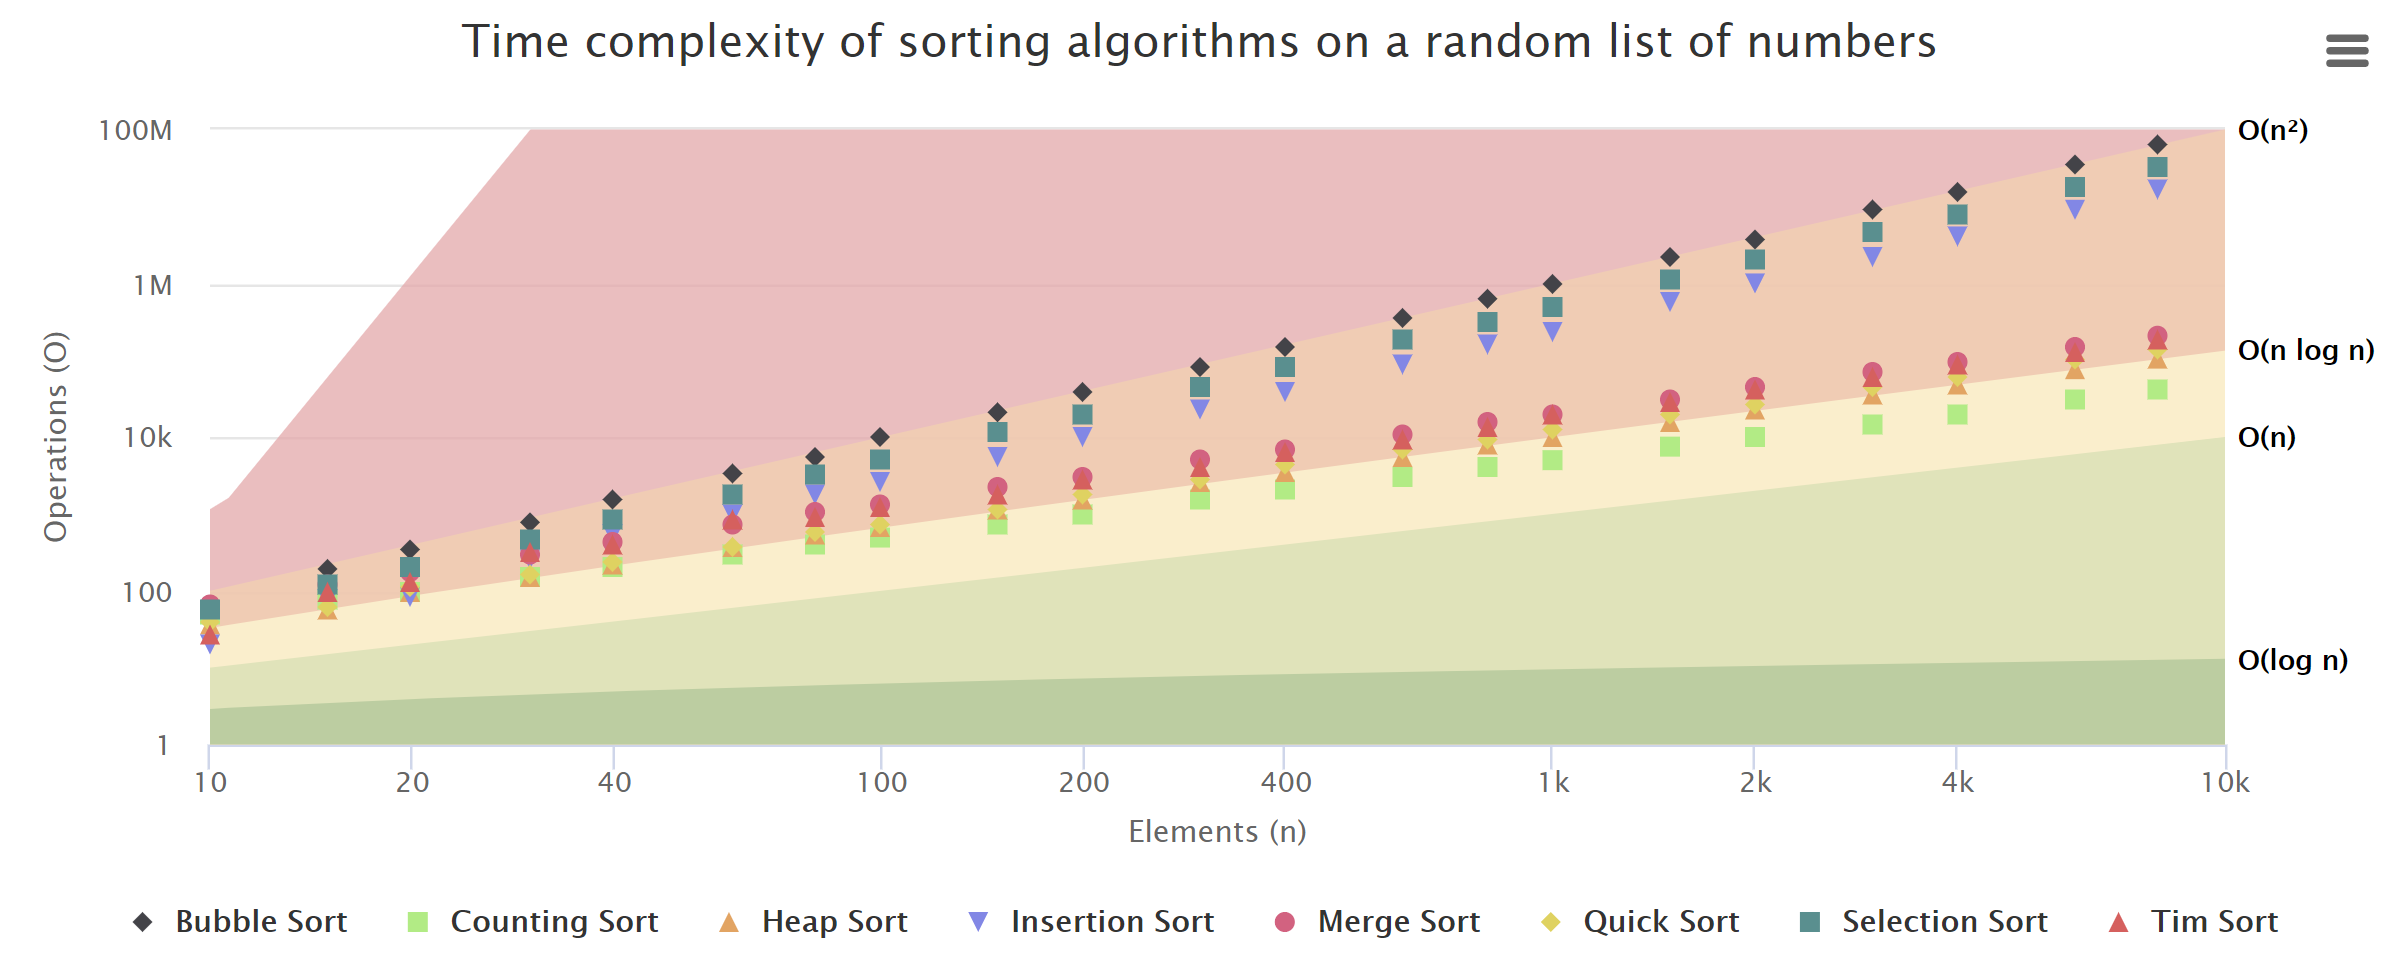
I came up with the idea for this project while doing a refresher on Computer Science fundamentals. A typical exercise followed the format: "Given problem statement X, implement an algorithm Y. What is the time complexity of Y? Can it be improved? If so, what is the best time complexity possible?". These questions are straightforward for simple or well-known algorithms, but when things get more exotic and there are a lot of moving parts involved, it can become quite hard to reason about an algorithm's time complexity. It was during this process that I had the thought of analyzing an algorithm's complexity by measuring its actual runtime behavior. And thus, the Big O(micron) Visualizer was born.
Being a pet-project, I picked a fresh stack of modern and exciting frameworks and technologies I wanted to familiarize myself with. The most notable technologies used in this project are React, Gatsby, TypeScript and Highcharts. This project was initialized using a popular Gatsby starter LekoArts/gatsby-starter-minimal-blog, which emphasizes typography and has minimal aesthetics. whawker/react-jsx-highcharts serves as the glue between Highcharts and React, making it easier to create charts that respond to things happening inside the website.
Feedback
If you have any questions or ideas, then please direct them at me by opening an issue on the project's GitHub repository. All feedback is welcome!
Thank you
- Lennart/LekoArts for making such cool Gatsby themes
- Will Hawker for making React JSX Highcharts
- Kyle Jensen for making javascript-algorithms
- Marco Ziccardi for making Node-TimSort and of course Tim Peters the original creator of TimSort